In the past week, Ethereum's price against the US Dollar ran into resistance close to the 1,780 dollar zone. The price of ETH was unable to gain momentum, and it immediately began a fresh decline below the $1,600 level.
There was a very noticeable movement below the support levels of $1,550 and $1,520. The pair continued to fall and broke below the $1,400 level as well as the 55 simple moving average (4-hours). It reached a low of $1,279 on the market before beginning an upward correction recently.
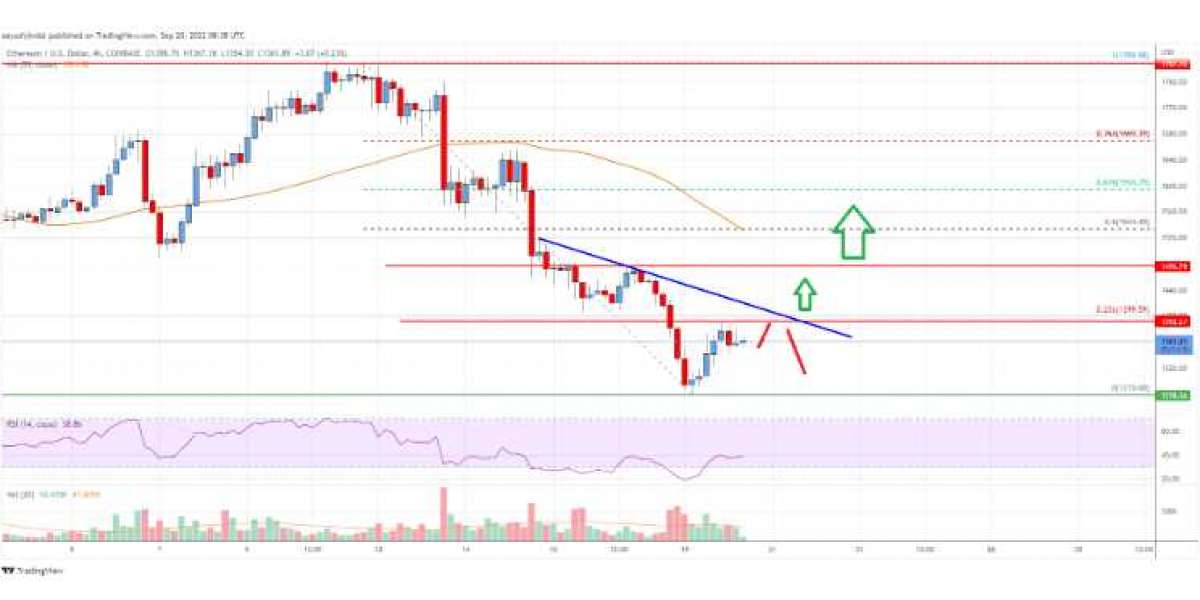
There was a distinct movement above the resistance zone located at $1,350. The price reached an area near the 23.6% Fib retracement level after making a downward move from a swing high of $1,789 to a low of $1,279.
The price has moved above the $1,350 level and is currently consolidating its losses. Near the level of $1,390 lies an immediate area of resistance. On the 4-hour chart, a significant bearish trend line is forming with resistance near $1,390. This trend line is also bearish. The price could test the 50% Fibonacci retracement level of the downward move from the swing high of $1,789 to the low of $1,279 if it is able to break through the next major resistance level, which is located close to the zone of $1,475.
Any additional gains could even send the price above the resistance zone at $1,680 if it continues. In the event that prices go lower, an initial support can be found close to the $1,320 level. The next significant support is now located close to the 1,280-dollar level.
Should the $1,280 support level be broken, the price may fall to the $1,200 level. In the event that there are further losses, the price may move closer to $1,150 or even $1,100 in the days to come.
Ethereum Price
As can be seen from the chart, the current price of Ethereum is trading well below the $1,600 mark as well as the 55-day simple moving average (4-hours). If there isn't a decisive move below the $1,280 zone for ether's price, there is a good chance that it will begin a new upward trend.
Technical indicators
4 hour MACD The MACD for ETH/USD is currently losing momentum in the bearish zone. This is a bearish sign.
The four-hour relative strength index (RSI) shows that the ETH/USD pair's RSI has dropped below the level of 50.
Key Support Levels are located at $1,320, followed by the zone around $1,280.
Resistance Factors
There are two price tiers: $1,380 and $1,475


Samuel Jephtar 2 yrs
Nice